<?xml version="1.0"?>
<rdf:RDF xmlns:foaf="http://xmlns.com/foaf/0.1/" xmlns:owl="http://www.w3.org/2002/07/owl#" xmlns:rdfs="http://www.w3.org/2000/01/rdf-schema#" xmlns:rdf="http://www.w3.org/1999/02/22-rdf-syntax-ns#" xmlns:dcat="http://www.w3.org/ns/dcat#" xmlns:dct="http://purl.org/dc/terms/" xmlns:adms="http://www.w3.org/ns/adms#" xmlns:dc="http://purl.org/dc/elements/1.1/" xmlns:time="http://www.w3.org/2006/time#" xmlns:dcterms="http://purl.org/dc/terms/" xmlns:vcard="http://www.w3.org/2006/vcard/ns#"><dcat:Dataset rdf:about="https://accscatalog.uaa.alaska.edu/dataset/north-slope-rapid-ecoregional-assessment"><dct:title>North Slope Rapid Ecoregional Assessment</dct:title><dct:description><![CDATA[<p><img alt="North Slope Rapid Ecoregional Assessment" title="North Slope Rapid Ecoregional Assessment" src="/sites/default/files/styles/panopoly_image_original/public/Banner_NOS-REA.jpg" /></p>
<p>Rapid Ecoregional Assessments (REAs) are intended to answer important management questions identified by land managers, collect and develop distribution maps for key resources, document potential impact of environmental change, identify science gaps, and provide baseline data for future management decisions.</p>
<p>In 2010, the Bureau of Land Management (BLM) initiated seven REAs to help understand the condition of western landscapes. These assessments evaluate current conditions and predict future conditions of the landscape and the effects of environmental influences on the region, including wildfire, invasive species, and development. REAs are rapid in nature, using existing data synthesized over an 18 month period. They also encompass broad geographic regions, crossing several different administrative boundaries.</p>
<p>The version below is the final document reviewed and approved by the BLM. The project report presents the detailed introduction, methods, results, limitations, and data gaps for all topics included in the North Slope REA.</p>
<p>The North Slope REA was prepared by the Alaska Center for Conservation Science in cooperation with the BLM, the Institute for Social and Economic Research, and the Scenarios Network for Alaska Planning.</p>
]]></dct:description><dcat:keyword>North Slope</dcat:keyword><dcat:keyword>Rapid Ecoregional Assessments</dcat:keyword><dcat:theme>Landscape Ecology</dcat:theme><dct:identifier>dca79918-ba51-4b95-a0e1-8097706b1805</dct:identifier><dct:issued>2018-02-19T13:03:54-09:00</dct:issued><dct:modified>2025-10-03T14:03:16-08:00</dct:modified><dct:language>en-US</dct:language><dcat:landingPage>https://catalog.accs.uaa.alaska.edu/dataset/north-slope-rapid-ecoregional-assessment-report</dcat:landingPage><dct:spatial>POLYGON ((-140.03173828125 67.495956708439, -140.09765625 70.06839376023, -142.3828125 70.54228811331, -146.6015625 70.832953109413, -153.017578125 71.541438942045, -156.357421875 71.872472408074, -158.642578125 71.541438942045, -162.685546875 70.832953109413, -164.1796875 70.06839376023, -165.234375 69.614076059913, -167.16796875 69.243498967199, -167.87109375 68.386031663986, -165.498046875 67.272042673995, -140.009765625 67.156097269634, -141.35009765625 67.1742172779, -140.009765625 67.156097269634, -140.04272460938 67.344093089357))</dct:spatial><dcat:distribution rdf:resource="https://accscatalog.uaa.alaska.edu/dataset/north-slope-rapid-ecoregional-assessment/resource/9db766e4-90df-46cc-a705-538cdd02778a"/><dcat:distribution rdf:resource="https://accscatalog.uaa.alaska.edu/dataset/north-slope-rapid-ecoregional-assessment/resource/955c7814-9fb8-4e14-96d5-1ec476dbd082"/><dcat:distribution rdf:resource="https://accscatalog.uaa.alaska.edu/dataset/north-slope-rapid-ecoregional-assessment/resource/997db753-5bb3-4584-b9bf-edab4c7ab3f8"/><dcat:distribution rdf:resource="https://accscatalog.uaa.alaska.edu/dataset/landscape-condition-north-slope-current-2015-medium-2040-and-high-scenario-2040/resource"/><dcat:distribution rdf:resource="https://accscatalog.uaa.alaska.edu/dataset/cumulative-impacts-north-slope-near-term-and-long-term-future/resource/c557b191-7438-40d2"/><dcat:distribution rdf:resource="https://accscatalog.uaa.alaska.edu/dataset/north-slope-rapid-ecoregional-assessment/resource/9395320e-260a-4761-94cc-b54873be16be"/><dcat:distribution rdf:resource="https://accscatalog.uaa.alaska.edu/dataset/air-quality-database-arctic-alaska-2016v10/resource/01d967a2-1406-4806-aed5-263a4acc5776"/><dcat:distribution rdf:resource="https://accscatalog.uaa.alaska.edu/dataset/porcupine-caribou-herd-range/resource/01ef84f8-00be-40fb-a605-00244513c294"/><dcat:distribution rdf:resource="https://accscatalog.uaa.alaska.edu/dataset/central-arctic-caribou-herd-range/resource/fcf93075-3f43-447c-a1da-31b6d806822a"/><dcat:distribution rdf:resource="https://accscatalog.uaa.alaska.edu/dataset/teshekpuk-caribou-herd-range/resource/a1dbac4b-f588-4c5d-bd55-7ea06c708a79"/><dcat:distribution rdf:resource="https://accscatalog.uaa.alaska.edu/dataset/ranges-arctic-alaska-caribou-herds/resource/2f56f07a-e12b-49b4-95a2-ba7937246593"/><dcat:distribution rdf:resource="https://accscatalog.uaa.alaska.edu/dataset/north-slope-rapid-ecoregional-assessment/resource/4ae9667f-f28e-4ec5-aa16-b6b629f03020"/></dcat:Dataset><dcat:Distribution rdf:about="https://accscatalog.uaa.alaska.edu/dataset/north-slope-rapid-ecoregional-assessment/resource/9db766e4-90df-46cc-a705-538cdd02778a"><dct:title>North Slope REA Manager&#x2019;s Summary</dct:title><dct:description><![CDATA[<p>The North Slope study area is almost entirely treeless arctic tundra, hosting numerous ecological resources and phenomena that are not found elsewhere in the state or country. The extremely cold climate, long dark winters, and short nightless summers have a major influence on the landscape and resident organisms. Approximately 10,000 people live in ten communities in the study area, with Barrow being the largest community with over 4,000 that serves as the regional hub for goods and services. Approximately 2,000 individuals in the region are transient workers associated with the largest oil field in the United States, Prudhoe Bay, its surrounding oil field industrial complexes, and associated support services. The BLM (39%), the State Department of Natural Resources (20%), the U.S. Fish and Wildlife Service (USFWS) (18%), and the National Park Service (NPS) (12%) manage approximately 89% of the North Slope study area. Please see the Technical Supplement for a more complete description of the physical, ecological, and socio-economic setting.</p>
<p>The Manager's Summary provides the major findings of the North Slope Rapid Ecoregional Assessment in a greatly condensed format.</p>
]]></dct:description><dct:issued>2018-02-19T13:15:21-09:00</dct:issued><dct:modified>2019-02-07T20:39:51-09:00</dct:modified><dcat:accessURL rdf:resource=""/><dcat:downloadURL rdf:resource="https://accscatalog.uaa.alaska.edu/sites/default/files/REA_NorthSlope_ManagerSummary.pdf"/><dcat:mediaType>application/pdf</dcat:mediaType><dct:format>pdf</dct:format><dcat:byteSize>11584562</dcat:byteSize><foaf:page>https://accscatalog.uaa.alaska.edu/dataset/north-slope-rapid-ecoregional-assessment/resource/9db766e4-90df-46cc-a705-538cdd02778a</foaf:page></dcat:Distribution><dcat:Distribution rdf:about="https://accscatalog.uaa.alaska.edu/dataset/north-slope-rapid-ecoregional-assessment/resource/955c7814-9fb8-4e14-96d5-1ec476dbd082"><dct:title>North Slope REA Final Report</dct:title><dct:description><![CDATA[<p>The North Slope study area is almost entirely treeless arctic tundra, hosting numerous ecological resources and phenomena that are not found elsewhere in the state or country. The extremely cold climate, long dark winters, and short nightless summers have a major influence on the landscape and resident organisms. Approximately 10,000 people live in ten communities in the study area, with Barrow being the largest community with over 4,000 that serves as the regional hub for goods and services. Approximately 2,000 individuals in the region are transient workers associated with the largest oil field in the United States, Prudhoe Bay, its surrounding oil field industrial complexes, and associated support services. The BLM (39%), the State Department of Natural Resources (20%), the U.S. Fish and Wildlife Service (USFWS) (18%), and the National Park Service (NPS) (12%) manage approximately 89% of the North Slope study area. Please see the Technical Supplement for a more complete description of the physical, ecological, and socio-economic setting.</p>
<p>The Final Report is the full detailed document containing the results of the North Slope Rapid Ecoregional Assessment.</p>
]]></dct:description><dct:issued>2018-02-19T13:07:13-09:00</dct:issued><dct:modified>2019-02-07T20:38:31-09:00</dct:modified><dcat:accessURL rdf:resource=""/><dcat:downloadURL rdf:resource="https://accscatalog.uaa.alaska.edu/sites/default/files/REA_NorthSlope_Report.pdf"/><dcat:mediaType>application/pdf</dcat:mediaType><dct:format>pdf</dct:format><dcat:byteSize>44389440</dcat:byteSize><foaf:page>https://accscatalog.uaa.alaska.edu/dataset/north-slope-rapid-ecoregional-assessment/resource/955c7814-9fb8-4e14-96d5-1ec476dbd082</foaf:page></dcat:Distribution><dcat:Distribution rdf:about="https://accscatalog.uaa.alaska.edu/dataset/north-slope-rapid-ecoregional-assessment/resource/997db753-5bb3-4584-b9bf-edab4c7ab3f8"><dct:title>North Slope Landscape Integrity</dct:title><dct:description><![CDATA[<p>Landscape condition should not be assessed at a particular location without some explicit consideration of the surrounding environment. Landscape intactness provides a quantifiable and readily assessable measure of naturalness: it is a measure of how contiguous a landscape is. The purpose of this dataset is to provide an assessment of the relative landscape condition across a region to identify if the areas with degraded conditions are isolated or connected, which corresponds to how resilient an area might be to future changes. Some elements of human modification, specifically subsistence harvest, are not captured well in current models of intactness. Therefore, we modeled landscape intactness by extracting areas from the Landscape Condition Model (LCM) with a value equal to 5 (corresponding to a score of 0.8 or higher) for the ecoregion, realizing that we likely underrepresented the true degree of human modification. Areas that meet the condition criteria were then lumped together into Large Intact Blocks (LIBs) and total areas of contiguous high condition landscape blocks were calculated. LIBs that are greater than or equal to 50,000 acres are considered as having the highest landscape intactness. Blocks that are less than 50,000 acres but greater than or equal to 10,000 acres correspond to high landscape integrity. Third, we identified all the blocks that are less than 10,000 acres as potentially vulnerable to disturbances. Most of the study area falls within the highest landscape integrity category. However, a substantial amount of small, fragmented areas were indeed identified throughout the region. Most of these fragmented habitats are located around communities and mining operations, but also include some areas fragmented by the larger rivers that serve as snowmachine travel corridors during winter months.</p>
<p><a href="https://catalog.accs.uaa.alaska.edu/sites/default/files/styles/panopoly_image_original/public/Figure_NorthSlopeLandsccapeIntactness.jpg"><center><img alt="landscape intactness on the North Slope" title="Landscape Intactness on the North Slope" width="600" src="https://catalog.accs.uaa.alaska.edu/sites/default/files/styles/panopoly_image_original/public/Figure_NorthSlopeLandsccapeIntactness.jpg" /></center></a></p>
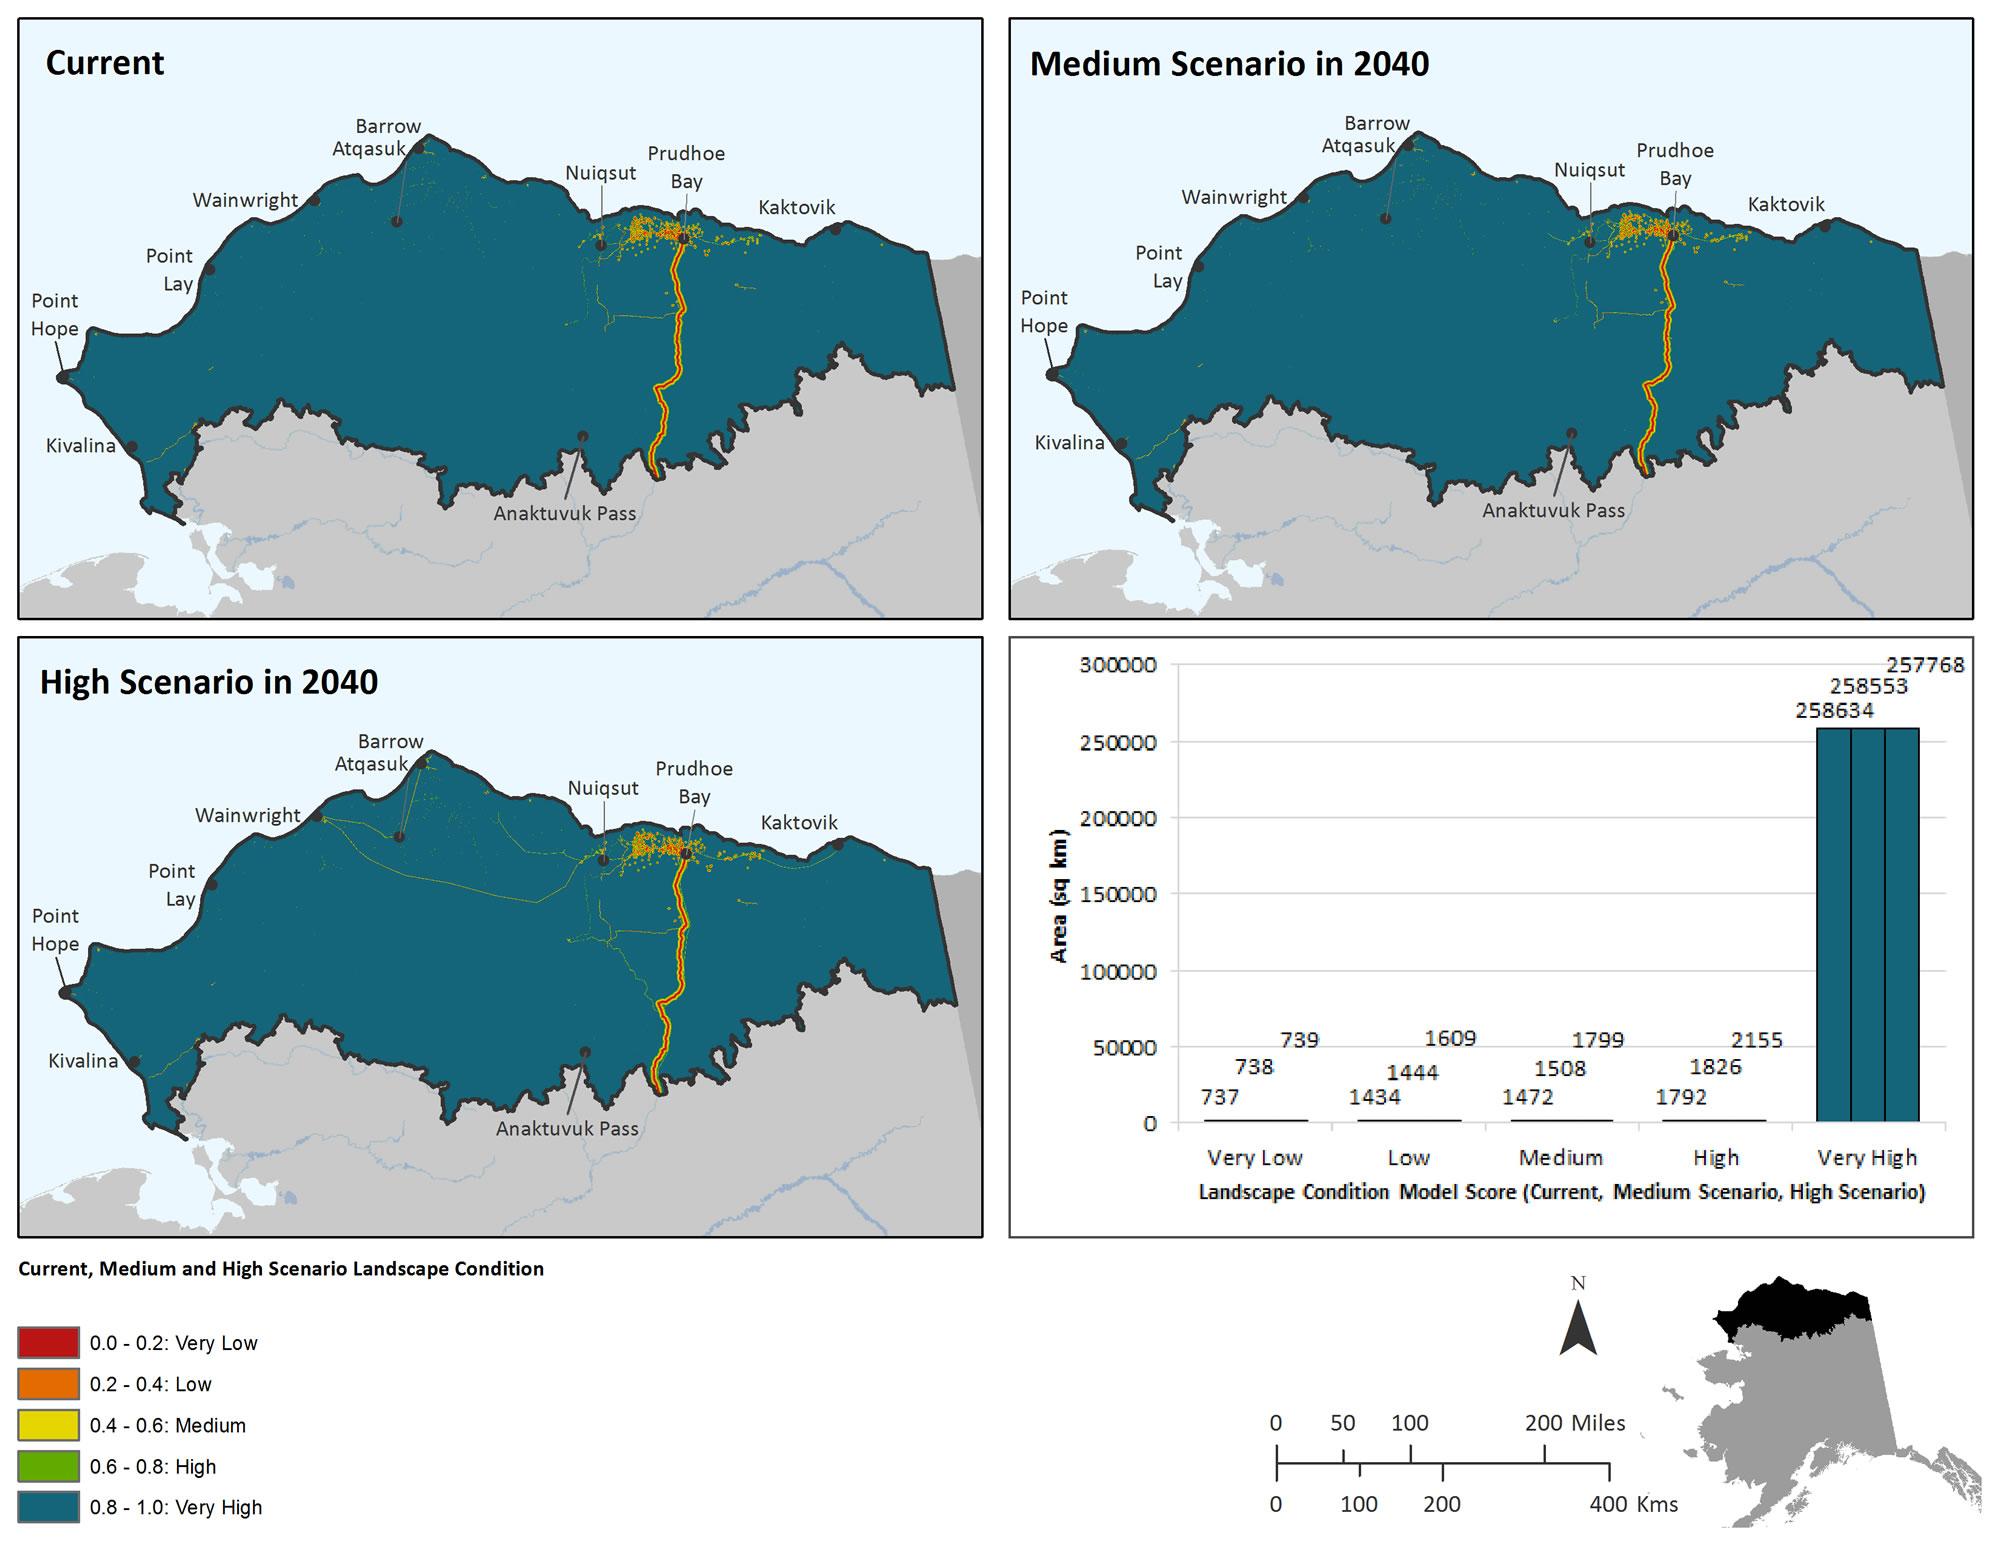
]]></dct:description><dct:issued>2018-02-14T12:11:30-09:00</dct:issued><dct:modified>2019-01-31T17:35:50-09:00</dct:modified><dcat:accessURL rdf:resource=""/><dcat:downloadURL rdf:resource="https://accscatalog.uaa.alaska.edu/sites/default/files/REA_NorthSlope_LandscapeIntegrity.zip"/><dcat:mediaType>application/zip</dcat:mediaType><dct:format>zip</dct:format><dcat:byteSize>502116</dcat:byteSize><foaf:page>https://accscatalog.uaa.alaska.edu/dataset/north-slope-rapid-ecoregional-assessment/resource/997db753-5bb3-4584-b9bf-edab4c7ab3f8</foaf:page></dcat:Distribution><dcat:Distribution rdf:about="https://accscatalog.uaa.alaska.edu/dataset/landscape-condition-north-slope-current-2015-medium-2040-and-high-scenario-2040/resource"><dct:title>North Slope Landscape Condition</dct:title><dct:description><![CDATA[<p>As a final measure of potential human impacts to the regions, the impacts of current anthropogenic development are summarized in a 60 x 60 m grid by the landscape condition model (LCM). The LCM weights the relative influence of different types of human footprints based on factors like permanence, nature of the activity, etc. Permanent human modification is weighted the highest, while temporary use (like snow roads, snow machine trails, etc.) receive less weight. Intensive land uses like mining are also weighted higher than less intensive land uses like hunting cabins. These weights are summed across the landscape and coalesced into a single surface identifying how impacted a given area is due to human modification. Categories of human impacts included in this analysis are transportation infrastructure, urban and industrial development, and invasive species. Distance decay values are assigned to each impact such that the impact declines with increasing distance from infrastructure. Human impacts of each type are merged according to MIN rules to create a final dataset. The analysis is intended to identify the current level of human impact in the North Slope. The output for landscape condition is a relative scale from 1 to 5, with values of 5 representing "Very High" landscape condition and values of 1 representing "Very Low" landscape condition. Infrastructure predictions for the high and medium development scenarios were provided by the NSSI Scenarios Project and are both centered around the year 2040.</p>
<p><a target="_blank" href="/sites/default/files/styles/panopoly_image_original/public/Figure_NorthSlopeLandscapeCondition.jpg"><center><img alt="Current (2015), Medium (2040), and High Scenario (2040) landscape condition on the North Slope" title="Current (2015), Medium (2040), and High Scenario (2040) landscape condition on the North Slope" width="600" src="/sites/default/files/styles/panopoly_image_original/public/Figure_NorthSlopeLandscapeCondition.jpg" /></center></a></p>
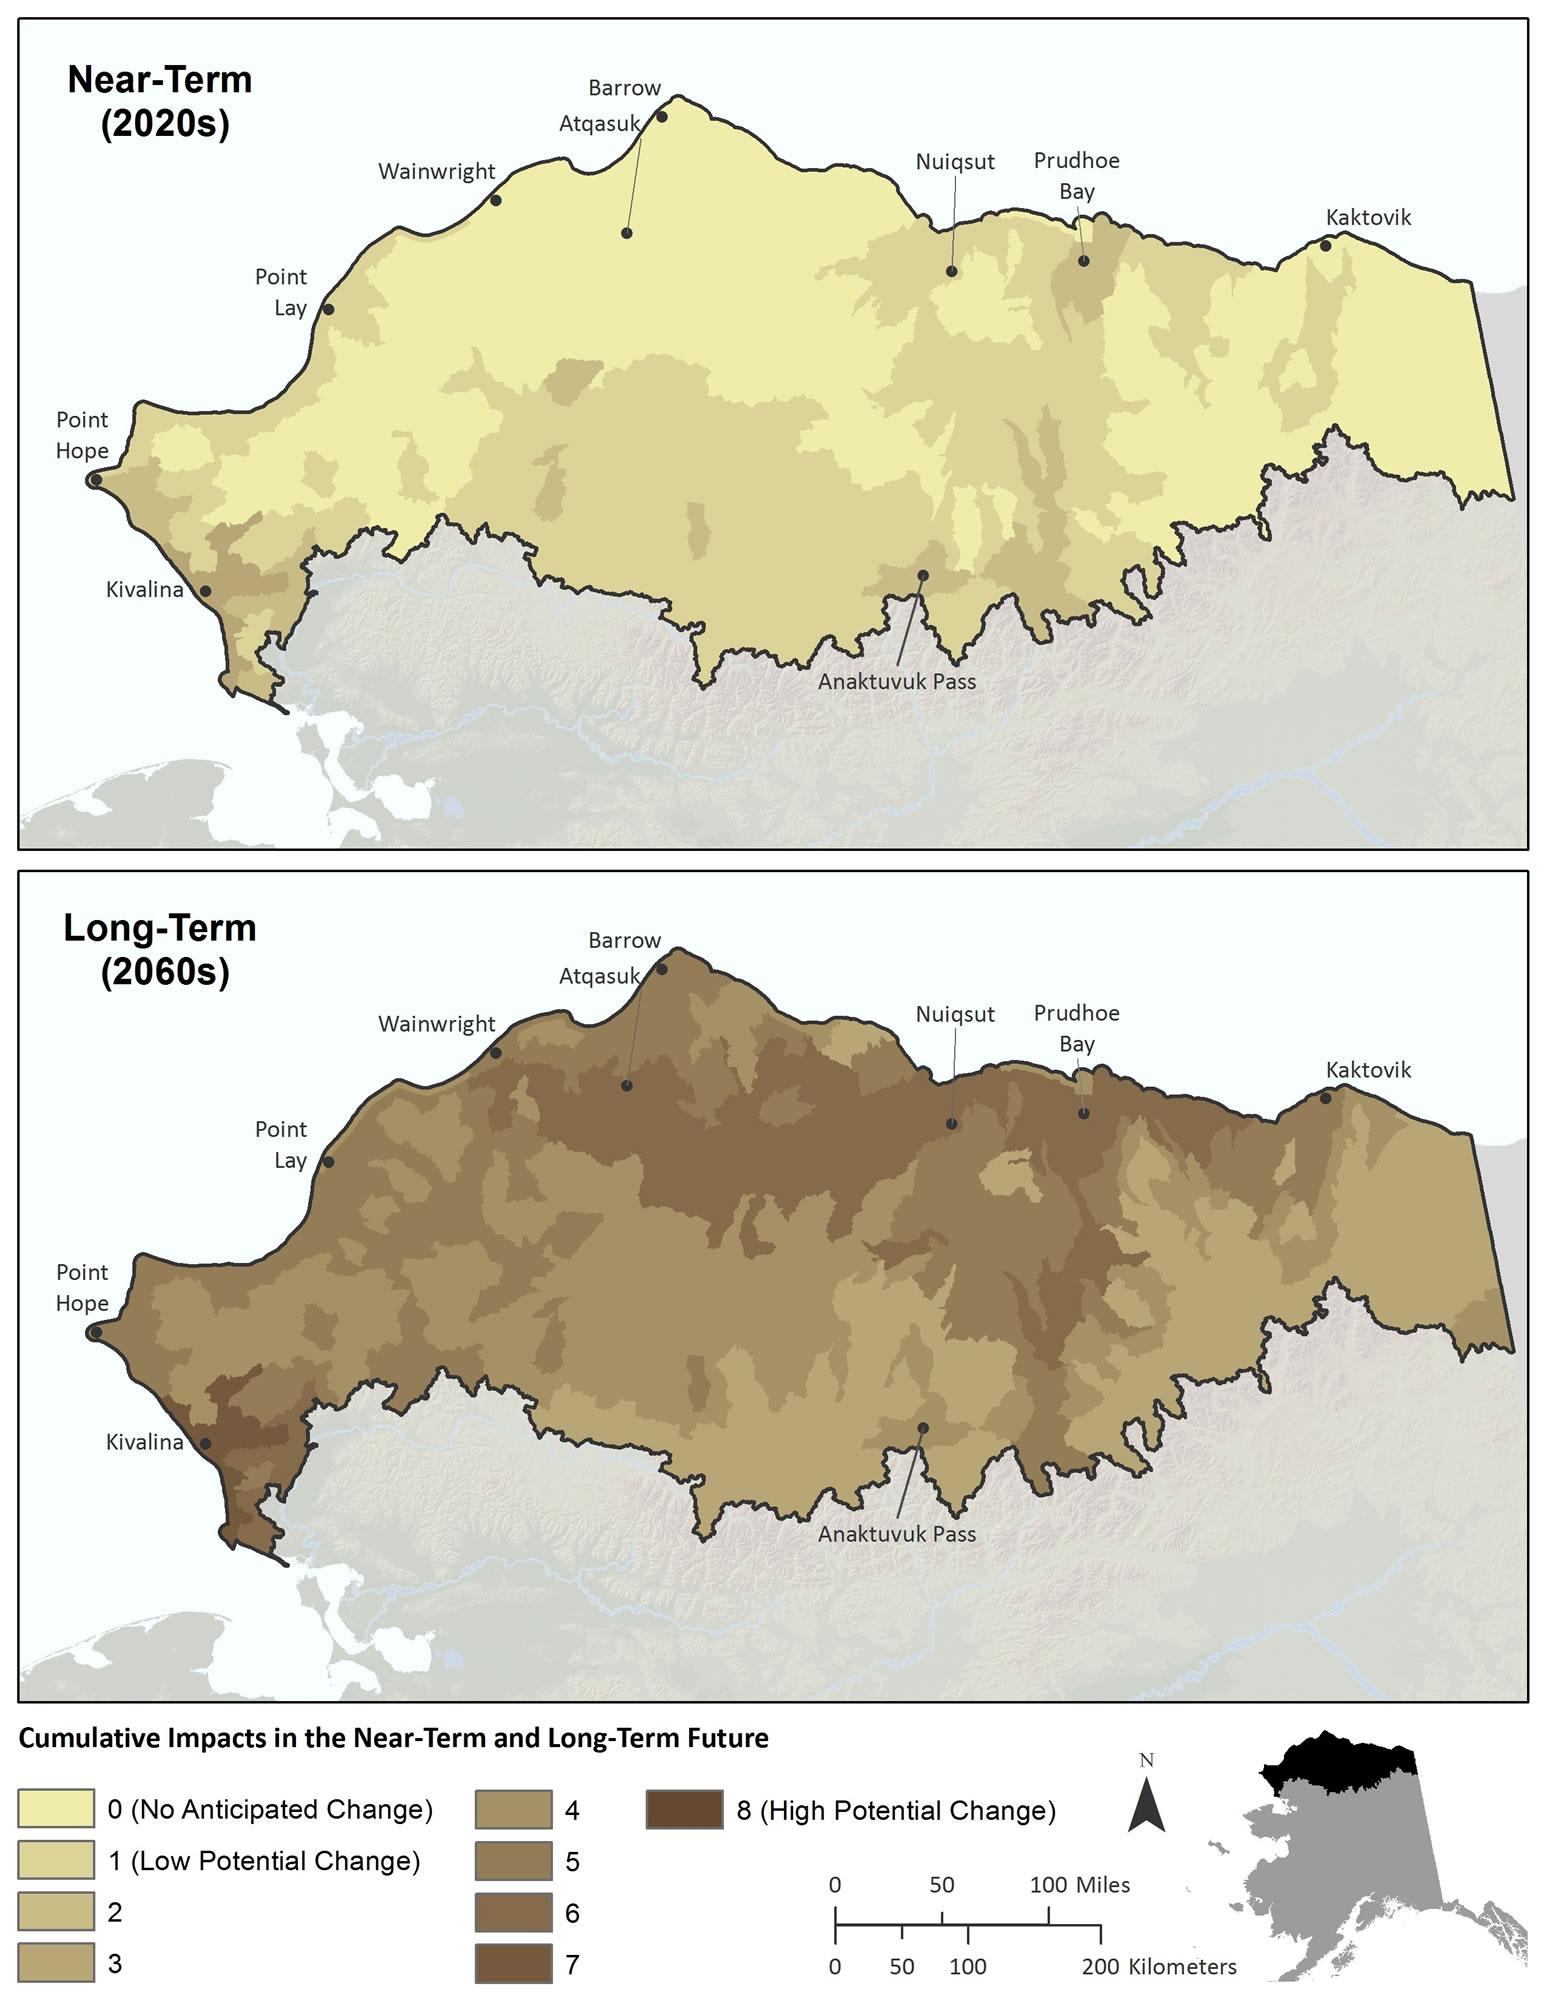
]]></dct:description><dct:issued>2018-02-14T11:11:16-09:00</dct:issued><dct:modified>2019-01-31T17:07:26-09:00</dct:modified><dcat:accessURL rdf:resource=""/><dcat:downloadURL rdf:resource="https://accscatalog.uaa.alaska.edu/sites/default/files/REA_NorthSlope_LandscapeCondition.zip"/><dcat:mediaType>application/zip</dcat:mediaType><dct:format>zip</dct:format><dcat:byteSize>838757</dcat:byteSize><foaf:page>https://accscatalog.uaa.alaska.edu/dataset/landscape-condition-north-slope-current-2015-medium-2040-and-high-scenario-2040/resource</foaf:page></dcat:Distribution><dcat:Distribution rdf:about="https://accscatalog.uaa.alaska.edu/dataset/cumulative-impacts-north-slope-near-term-and-long-term-future/resource/c557b191-7438-40d2"><dct:title>North Slope Cumulative Impacts</dct:title><dct:description><![CDATA[<p>This Cumulative Impacts analysis provides a comprehensive measure of potential impacts to ecoregions by summarizing potential impacts (generalized to the 5th-level HUC) and includes primary, measurable variables that are likely to have the largest and most direct impact in the North Slope in the future. In order to “sum” the impacts, thresholds for meaningful change were defined for each variable. Cumulative Impacts are not specific to any ecosystem constituent or process but are intended to be representative of the ecosystem as a whole, so thresholds for meaningful change are based on model variability and the potential to impact management decisions. This dataset does not assess the likely collinearity of change agents, but rather considers each change agent as a separate stressor that will differentially impact resources in the area. The inverse of this dataset could be seen as a landscape vulnerability index (LVI) that could be used to assist in future resource planning efforts.</p>
<p><a href="/sites/default/files/styles/panopoly_image_original/public/Figure_NorthSlopeCumulativeImpacts.jpg"><center><img alt="Cumulative impact assessment summarized at the 5th-level hydrologic unit" title="Cumulative impacts on the North Slope" width="500" src="/sites/default/files/styles/panopoly_image_original/public/Figure_NorthSlopeCumulativeImpacts.jpg" /></center></a></p>
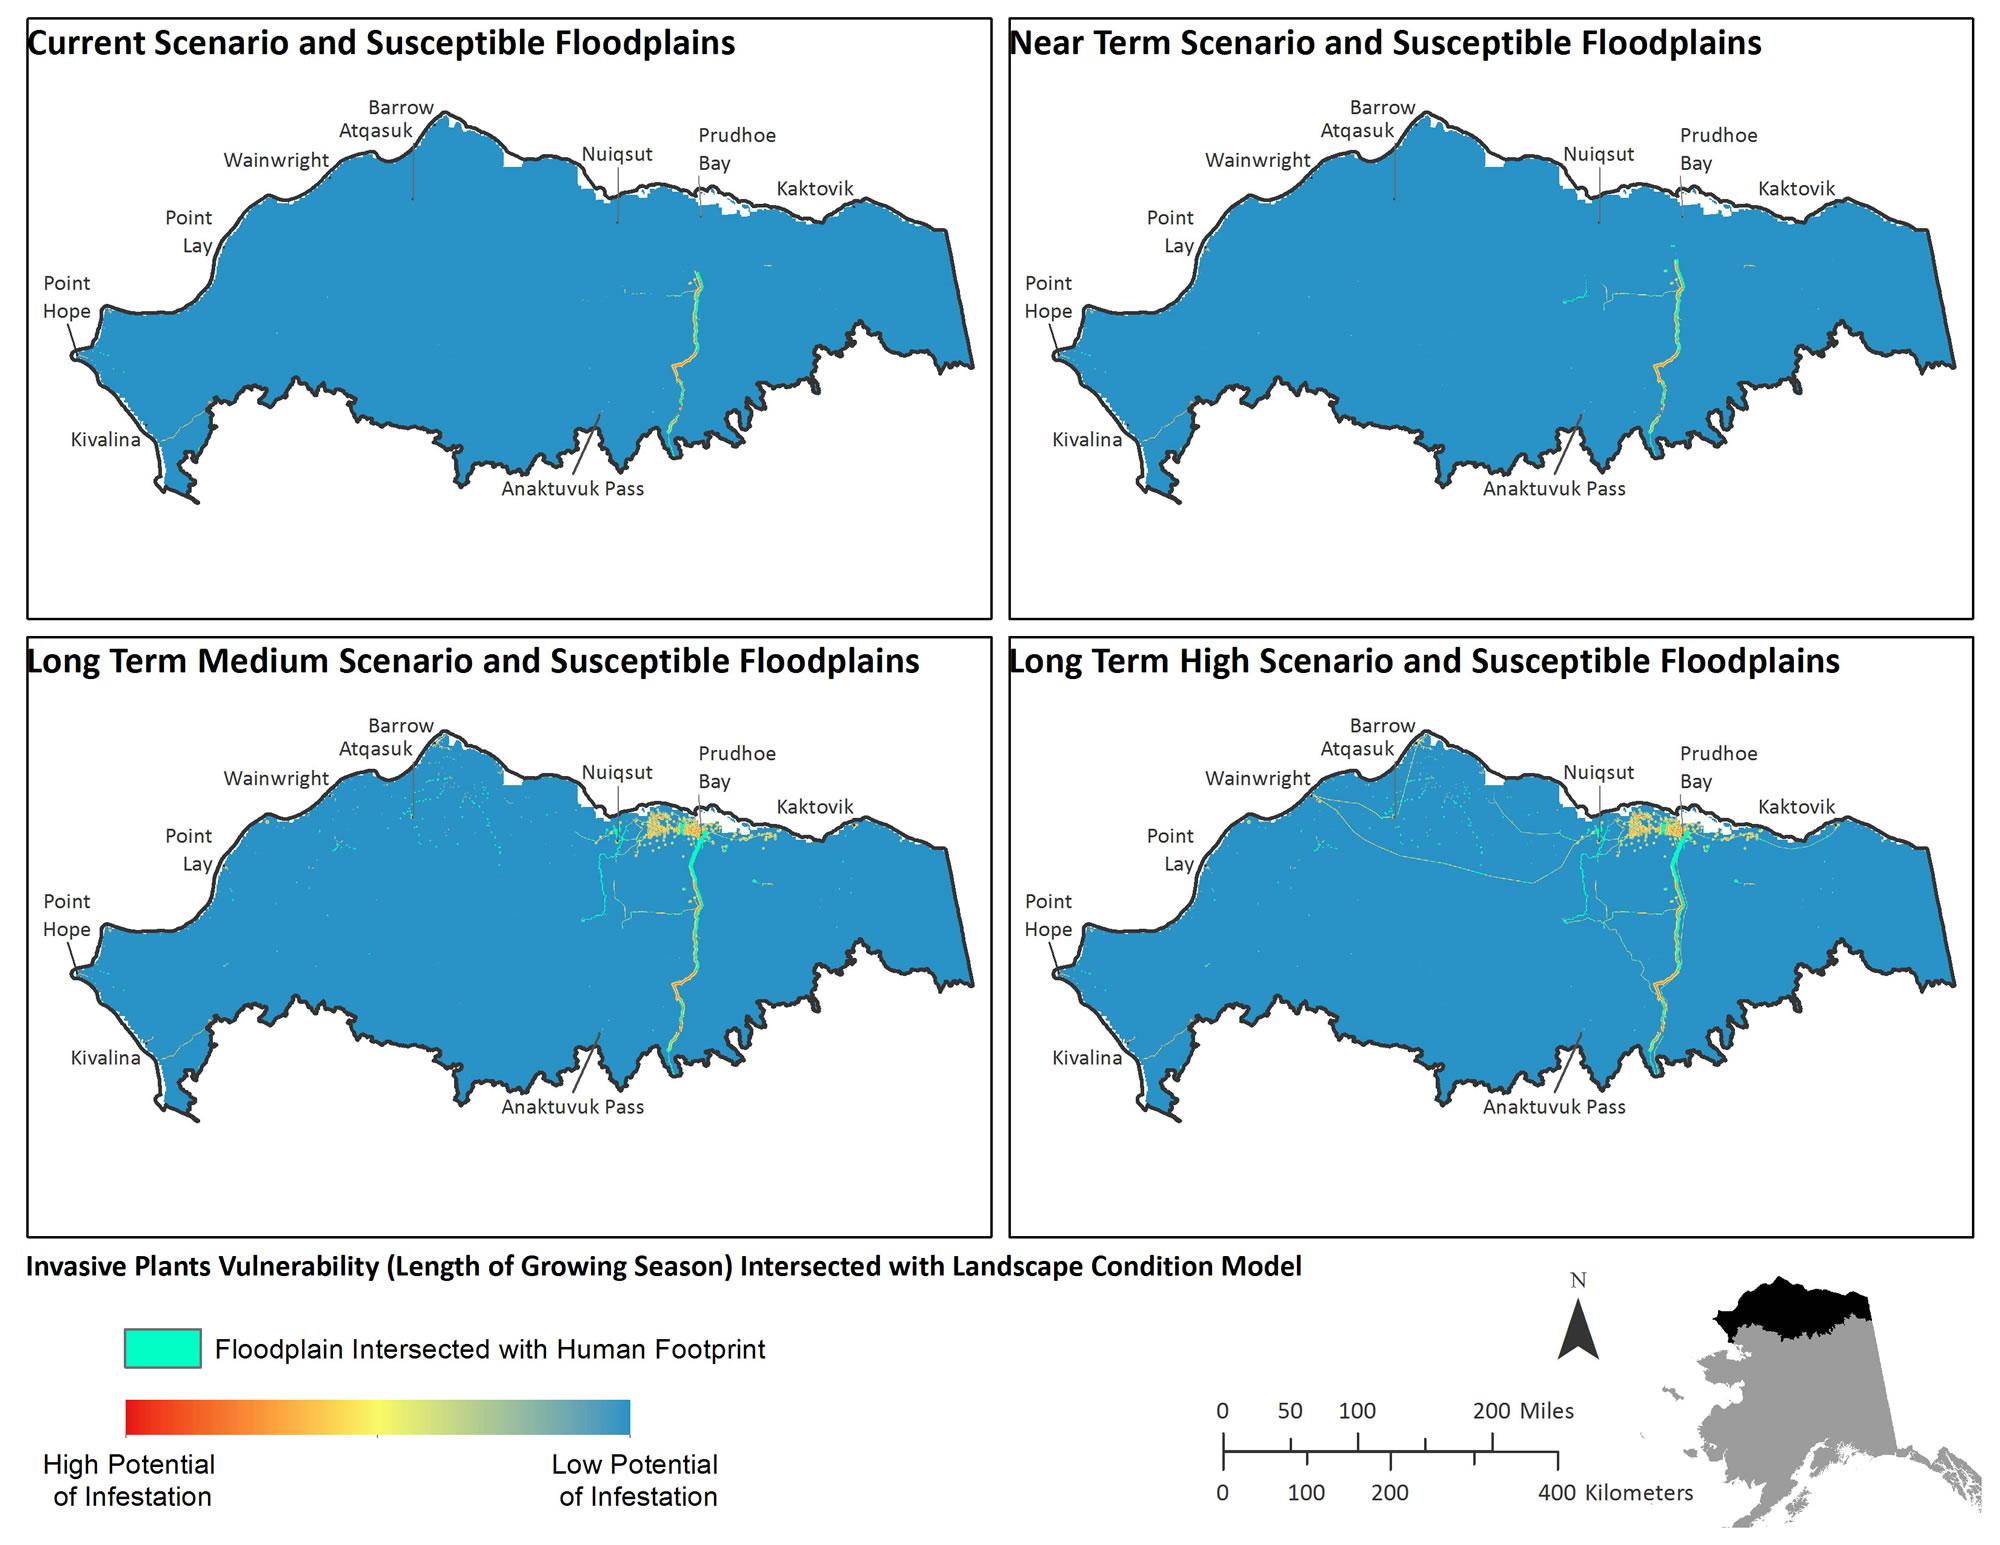
]]></dct:description><dct:issued>2018-02-14T11:37:57-09:00</dct:issued><dct:modified>2019-01-31T16:50:32-09:00</dct:modified><dcat:accessURL rdf:resource=""/><dcat:downloadURL rdf:resource="https://accscatalog.uaa.alaska.edu/sites/default/files/CumulativeImpacts.zip"/><dcat:mediaType>application/zip</dcat:mediaType><dct:format>zip</dct:format><dcat:byteSize>512525</dcat:byteSize><foaf:page>https://accscatalog.uaa.alaska.edu/dataset/cumulative-impacts-north-slope-near-term-and-long-term-future/resource/c557b191-7438-40d2</foaf:page></dcat:Distribution><dcat:Distribution rdf:about="https://accscatalog.uaa.alaska.edu/dataset/north-slope-rapid-ecoregional-assessment/resource/9395320e-260a-4761-94cc-b54873be16be"><dct:title>North Slope Plant Infestation Potential</dct:title><dct:description><![CDATA[<p>Our assessment suggests that floodplain habitats to include portions or all of Sagavanirktok River, Colville River downstream of Umiat, Kukpuk, Noatak, Ikpikpuk, Meade, Kuk, and Kukpowruk River floodplains are currently vulnerable to invasion. Barrier islands are not anticipated to be vulnerable to invasion currently or in the near term, but nearly all barrier island areas are expected in increase in invasion risk by 2060.</p>
<h3>Current</h3>
<p>This dataset provides the potential of current non-native plant infestation in the North Slope. It was produced by combining the landscape condition model and the length of growing season. The current length of growing season was intersected with current landscape condition. Areas predicted to have higher probabilities of invasion potential by at least the most cold-tolerant suite of species are shown in warmer colors. It suggests that the region currently and into the near term is likely to have a non-native plant species restricted to a very small area. By 2060 however, all villages and the human footprint associated with the oil fields is expected to increase in probability of non-native plant invasion.</p>
<h3>Near-term Future</h3>
<p>This dataset provides the potential of near-term future non-native plant infestation in the North Slope. It uses the human footprint from the medium development scenario (2040), which was substituted for a near-term future (2025) development scenario throughout the project. Infestation Potential was produced by combining the landscape condition model and the length of growing season. The current length of growing season was intersected with landscape condition. Areas predicted to have higher probabilities of invasion potential by at least the most cold-tolerant suite of species are shown in warmer colors. It suggests that the region currently and into the near term is likely to have a non-native plant species restricted to a very small area. By 2060 however, all villages and the human footprint associated with the oil fields is expected to increase in probability of non-native plant invasion.</p>
<h3>Long-term Future: Medium &amp; High Development Scenarios</h3>
<p>This dataset provides the potential of long-term future non-native plant infestation in the North Slope. It uses the human footprint from the medium development scenario (2040), which was substituted for a near-term future (2025) development scenario throughout the rest of the project. Infestation Potential was produced by combining the landscape condition model and the length of growing season. The current length of growing season was intersected with landscape condition. Areas predicted to have higher probabilities of invasion potential by at least the most cold-tolerant suite of species are shown in warmer colors. It suggests that the region currently and into the near term is likely to have a non-native plant species restricted to a very small area. By 2060 however, all villages and the human footprint associated with the oil fields is expected to increase in probability of non-native plant invasion.</p>
<p><a href="/sites/default/files/styles/panopoly_image_original/public/Figure_NorthSlopeInfestationPotential.jpg"><center><img alt="Modeled infestation vulnerability" title="Modeled Infestation Vulnerability" height="500" width="647" src="/sites/default/files/styles/panopoly_image_original/public/Figure_NorthSlopeInfestationPotential.jpg" /></center></a></p>
]]></dct:description><dct:issued>2018-02-14T13:22:19-09:00</dct:issued><dct:modified>2019-02-07T20:25:18-09:00</dct:modified><dcat:accessURL rdf:resource=""/><dcat:downloadURL rdf:resource="https://accscatalog.uaa.alaska.edu/sites/default/files/REA_NorthSlope_InfestationPotential.zip"/><dcat:mediaType>application/zip</dcat:mediaType><dct:format>zip</dct:format><dcat:byteSize>8598629</dcat:byteSize><foaf:page>https://accscatalog.uaa.alaska.edu/dataset/north-slope-rapid-ecoregional-assessment/resource/9395320e-260a-4761-94cc-b54873be16be</foaf:page></dcat:Distribution><dcat:Distribution rdf:about="https://accscatalog.uaa.alaska.edu/dataset/air-quality-database-arctic-alaska-2016v10/resource/01d967a2-1406-4806-aed5-263a4acc5776"><dct:title>Air Quality Database for Arctic Alaska - 2016(v1.0)</dct:title><dct:description><![CDATA[<p>The Air Quality Database (AQD) was created to summarize available information relevant to address air quality management decision making on the North Slope of Alaska. The database was originally created in 2015 as part of the BLM North Slope Rapid Ecoregional Assessment. BLM together with the Alaska Department of Environmental Conservation completed a recent review and update of the database for 2016.</p>
<p>The AQD has three different ACCESS tables that contain data, literature and models that are relevant to the assessment of North Slope air quality. Where appropriate, links to data, literature and additional information are provided in the database. ACCESS forms and reports are also provided as part of AQD for easier viewing and printing of AQD information. For a complete description of the AQD please refer to the Readme file.</p>
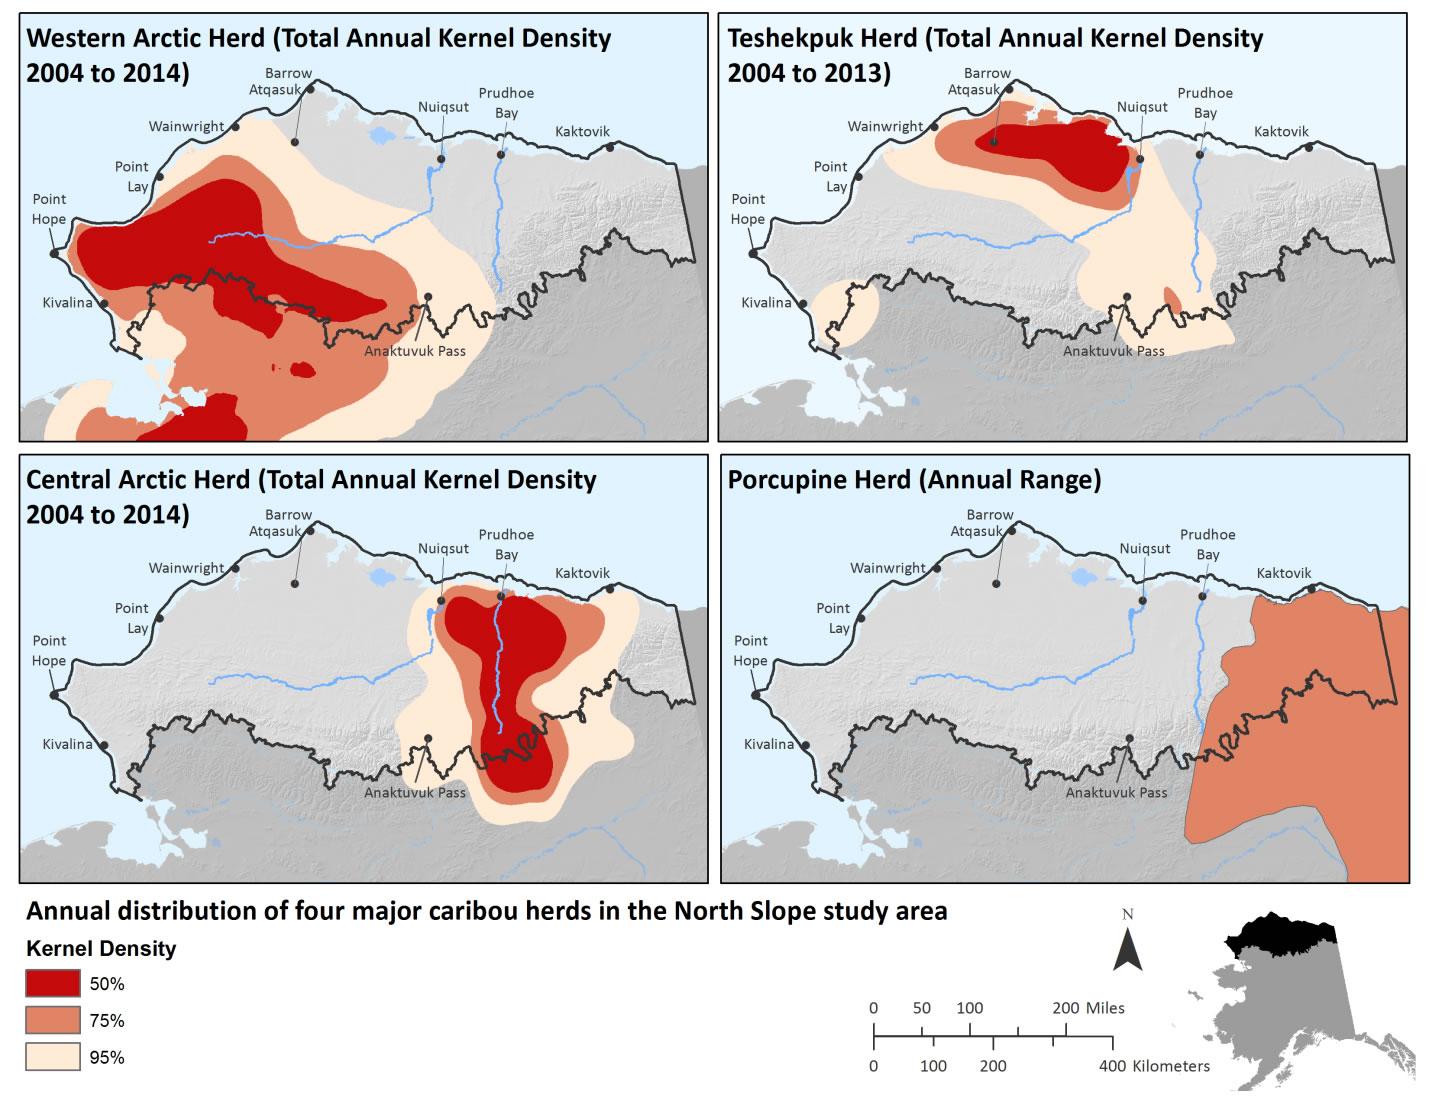
]]></dct:description><dct:issued>2018-02-01T11:13:09-09:00</dct:issued><dct:modified>2019-01-31T16:32:54-09:00</dct:modified><dcat:accessURL rdf:resource="http://catalog.northslopescience.org/catalog/entries/8363-air-quality-database-for-arctic-alaska-201"/><dcat:downloadURL rdf:resource=""/><dcat:mediaType></dcat:mediaType><dct:format>html</dct:format><dcat:byteSize></dcat:byteSize><foaf:page>https://accscatalog.uaa.alaska.edu/dataset/air-quality-database-arctic-alaska-2016v10/resource/01d967a2-1406-4806-aed5-263a4acc5776</foaf:page></dcat:Distribution><dcat:Distribution rdf:about="https://accscatalog.uaa.alaska.edu/dataset/porcupine-caribou-herd-range/resource/01ef84f8-00be-40fb-a605-00244513c294"><dct:title>Range for the Porcupine Herd </dct:title><dct:description><![CDATA[<p>The Alaska Department of Fish and Game (ADFG) maintain radio collar and satellite telemetry data for several herds across Alaska. However, no kernel density or radio/satellite-collar data is available for the Porcupine Herd because of shared management with Canada. Therefor 1983 to 2001 annual range and calving range of the Porcupine Herd reported in Arctic Refuge Coastal Plain Terrestrial Wildlife Research Summaries were digitized in generating the range. All other seasonal range polygons were hand-delineated based on a variety of past reports and datasets.</p>
<p><a href="/sites/default/files/styles/panopoly_image_original/public/Figure_AnnualDistributionArcticCaribou.jpg"><center><img alt="Annual Kernel Densities of North Slope Caribou Herds" title="Annual Kernel Densities of North Slope Caribou Herds" width="600" src="/sites/default/files/styles/panopoly_image_original/public/Figure_AnnualDistributionArcticCaribou.jpg" /></center></a></p>
]]></dct:description><dct:issued>2018-02-06T17:16:21-09:00</dct:issued><dct:modified>2019-01-31T17:20:26-09:00</dct:modified><dcat:accessURL rdf:resource=""/><dcat:downloadURL rdf:resource="https://accscatalog.uaa.alaska.edu/sites/default/files/PorcupineCaribouHerdRange.zip"/><dcat:mediaType>application/zip</dcat:mediaType><dct:format>zip</dct:format><dcat:byteSize>278015</dcat:byteSize><foaf:page>https://accscatalog.uaa.alaska.edu/dataset/porcupine-caribou-herd-range/resource/01ef84f8-00be-40fb-a605-00244513c294</foaf:page></dcat:Distribution><dcat:Distribution rdf:about="https://accscatalog.uaa.alaska.edu/dataset/central-arctic-caribou-herd-range/resource/fcf93075-3f43-447c-a1da-31b6d806822a"><dct:title>Range for the Central Arctic Herd</dct:title><dct:description><![CDATA[<p>The Alaska Department of Fish and Game (ADF&amp;G) maintains radio collar and satellite telemetry data for the Western Arctic, Teshekpuk, and Central Arctic herds. ADF&amp;G summarized the telemetry data as kernel densities to delineate the total annual distributions of the three caribou herds. Collar location data points were extracted from the entire annual cycle from 2004 to 2013 for the Teshekpuk Herd and 2004 to 2014 for the Western Arctic and Central Arctic herds. For each day, the location point closest to noon was selected, with no more than one location every six days per individual. The resulting set of points served as the input for kernel density calculations. Kernel density was calculated for individual years and the results were summed to capture annual variability in caribou habitat use. Through a data sharing agreement between ADF&amp;G and AKNHP, these kernel densities were available for the North Slope REA. Kernel densities are based on the daily positions of a small subset of individuals from the total herd. For example, no more than 0.03% of the Western Arctic Herd has been collared. No kernel density or radio/satellite-collar data was available for the Porcupine Herd because of shared management with Canada. The 1983 to 2001 annual range of the herd reported in Griffith et al. (2002) was digitized for this assessment. The calving range of the Porcupine Herd was digitized from the 1983 to 2001 calving range reported in Griffith et al. 2002. All other seasonal range polygons were hand-delineated based on a variety of past reports and datasets.</p>
<p><a target="_blank" href="/sites/default/files/styles/panopoly_image_original/public/Figure_AnnualDistributionArcticCaribou.jpg"><center><img alt="Annual Kernel Densities of North Slope Caribou Herds" title="Annual Kernel Densities of North Slope Caribou Herds" width="600" src="/sites/default/files/styles/panopoly_image_original/public/Figure_AnnualDistributionArcticCaribou.jpg" /></center></a></p>
]]></dct:description><dct:issued>2018-02-08T09:36:59-09:00</dct:issued><dct:modified>2019-01-31T17:26:28-09:00</dct:modified><dcat:accessURL rdf:resource=""/><dcat:downloadURL rdf:resource="https://accscatalog.uaa.alaska.edu/sites/default/files/CentralArcticCaribouHerdRange.zip"/><dcat:mediaType>application/zip</dcat:mediaType><dct:format>zip</dct:format><dcat:byteSize>519053</dcat:byteSize><foaf:page>https://accscatalog.uaa.alaska.edu/dataset/central-arctic-caribou-herd-range/resource/fcf93075-3f43-447c-a1da-31b6d806822a</foaf:page></dcat:Distribution><dcat:Distribution rdf:about="https://accscatalog.uaa.alaska.edu/dataset/teshekpuk-caribou-herd-range/resource/a1dbac4b-f588-4c5d-bd55-7ea06c708a79"><dct:title>Range for the Teshekpuk Herd</dct:title><dct:description><![CDATA[<p>The Alaska Department of Fish and Game (ADF&amp;G) maintains radio collar and satellite telemetry data for the Western Arctic, Teshekpuk, and Central Arctic herds. ADF&amp;G summarized the telemetry data as kernel densities to delineate the total annual distributions of the three caribou herds. Collar location data points were extracted from the entire annual cycle from 2004 to 2013 for the Teshekpuk Herd and 2004 to 2014 for the Western Arctic and Central Arctic herds. For each day, the location point closest to noon was selected, with no more than one location every six days per individual. The resulting set of points served as the input for kernel density calculations. Kernel density was calculated for individual years and the results were summed to capture annual variability in caribou habitat use. Through a data sharing agreement between ADF&amp;G and AKNHP, these kernel densities were available for the North Slope REA. Kernel densities are based on the daily positions of a small subset of individuals from the total herd. For example, no more than 0.03% of the Western Arctic Herd has been collared. No kernel density or radio/satellite-collar data was available for the Porcupine Herd because of shared management with Canada. The 1983 to 2001 annual range of the herd reported in Griffith et al. (2002) was digitized for this assessment. The calving range of the Porcupine Herd was digitized from the 1983 to 2001 calving range reported in Griffith et al. 2002. All other seasonal range polygons were hand-delineated based on a variety of past reports and datasets.</p>
<p><a target="_blank" href="/sites/default/files/styles/panopoly_image_original/public/Figure_AnnualDistributionArcticCaribou.jpg"><center><img alt="Annual Kernel Densities of North Slope Caribou Herds" title="Annual Kernel Densities of North Slope Caribou Herds" width="600" src="/sites/default/files/styles/panopoly_image_original/public/Figure_AnnualDistributionArcticCaribou.jpg" /></center></a></p>
]]></dct:description><dct:issued>2018-02-20T09:36:15-09:00</dct:issued><dct:modified>2019-01-31T17:22:16-09:00</dct:modified><dcat:accessURL rdf:resource=""/><dcat:downloadURL rdf:resource="https://accscatalog.uaa.alaska.edu/sites/default/files/TeshekpukCaribouHerdRange.zip"/><dcat:mediaType>application/zip</dcat:mediaType><dct:format>zip</dct:format><dcat:byteSize>788080</dcat:byteSize><foaf:page>https://accscatalog.uaa.alaska.edu/dataset/teshekpuk-caribou-herd-range/resource/a1dbac4b-f588-4c5d-bd55-7ea06c708a79</foaf:page></dcat:Distribution><dcat:Distribution rdf:about="https://accscatalog.uaa.alaska.edu/dataset/ranges-arctic-alaska-caribou-herds/resource/2f56f07a-e12b-49b4-95a2-ba7937246593"><dct:title>Range for the Western Arctic Caribou Herd</dct:title><dct:description><![CDATA[<p>The Alaska Department of Fish and Game (ADF&amp;G) maintains radio collar and satellite telemetry data for the Western Arctic, Teshekpuk, and Central Arctic herds. ADF&amp;G summarized the telemetry data as kernel densities to delineate the total annual distributions of the three caribou herds. Collar location data points were extracted from the entire annual cycle from 2004 to 2013 for the Teshekpuk Herd and 2004 to 2014 for the Western Arctic and Central Arctic herds. For each day, the location point closest to noon was selected, with no more than one location every six days per individual. The resulting set of points served as the input for kernel density calculations. Kernel density was calculated for individual years and the results were summed to capture annual variability in caribou habitat use. Through a data sharing agreement between ADF&amp;G and AKNHP, these kernel densities were available for the North Slope REA. Kernel densities are based on the daily positions of a small subset of individuals from the total herd. For example, no more than 0.03% of the Western Arctic Herd has been collared. No kernel density or radio/satellite-collar data was available for the Porcupine Herd because of shared management with Canada. The 1983 to 2001 annual range of the herd reported in Griffith et al. (2002) was digitized for this assessment. The calving range of the Porcupine Herd was digitized from the 1983 to 2001 calving range reported in Griffith et al. 2002. All other seasonal range polygons were hand-delineated based on a variety of past reports and datasets.</p>
<p><a target="_blank" href="/sites/default/files/styles/panopoly_image_original/public/Figure_AnnualDistributionArcticCaribou.jpg"><center><img alt="Annual Kernel Densities of North Slope Caribou Herds" title="Annual Kernel Densities of North Slope Caribou Herds" width="600" src="/sites/default/files/styles/panopoly_image_original/public/Figure_AnnualDistributionArcticCaribou.jpg" /></center></a></p>
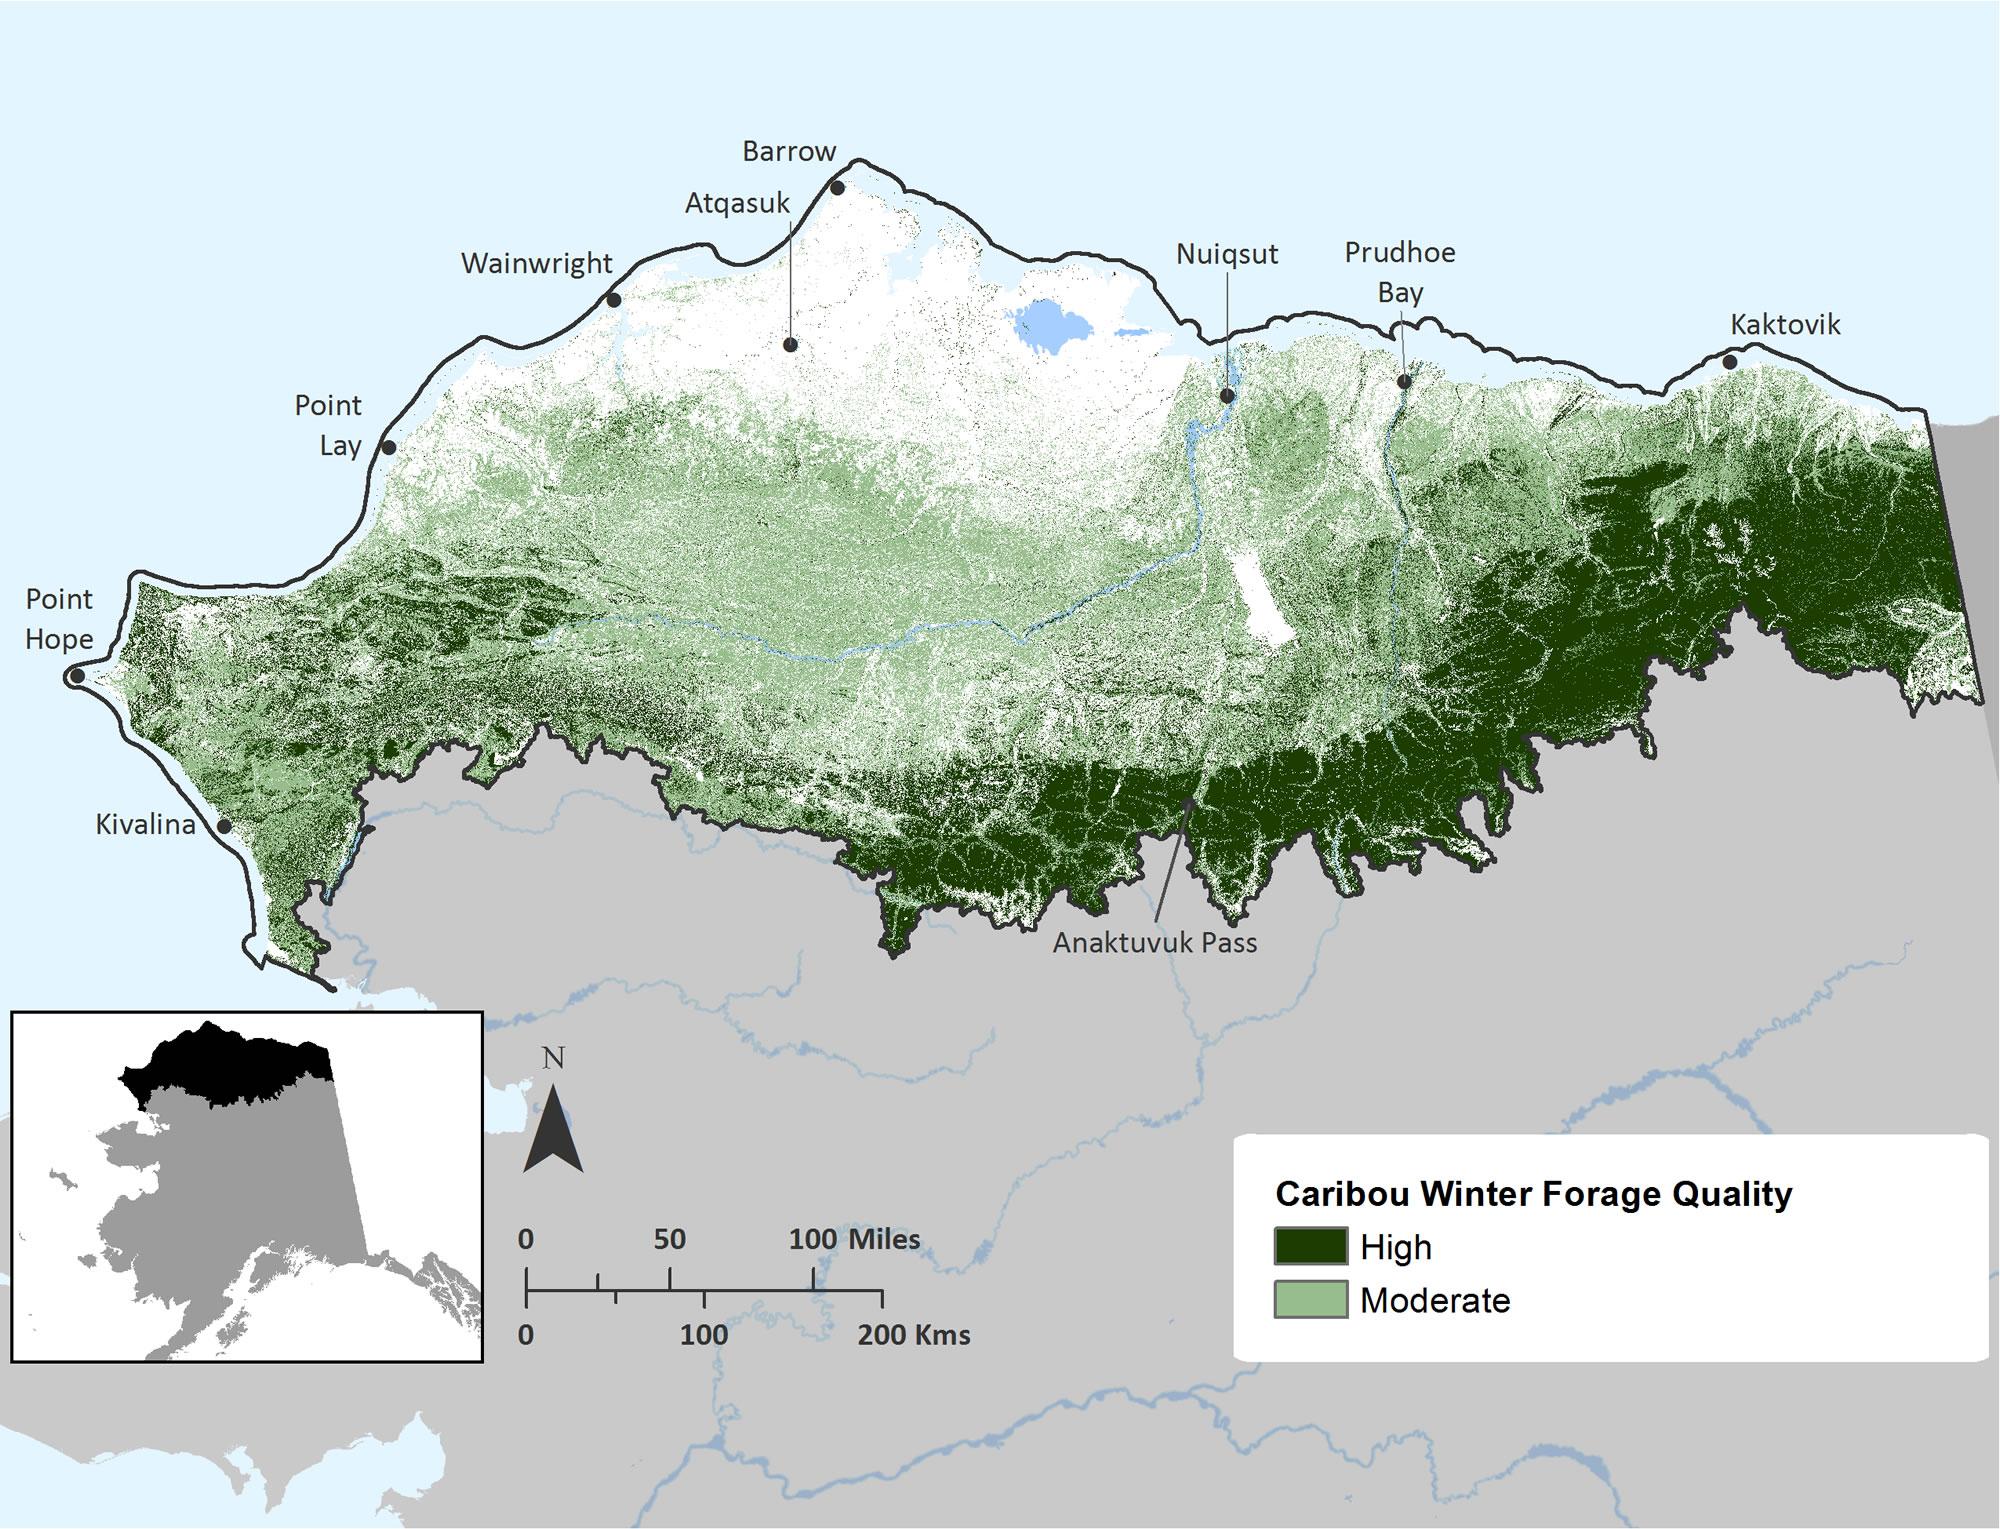
]]></dct:description><dct:issued>2018-02-20T09:45:50-09:00</dct:issued><dct:modified>2019-01-31T17:21:41-09:00</dct:modified><dcat:accessURL rdf:resource=""/><dcat:downloadURL rdf:resource="https://accscatalog.uaa.alaska.edu/sites/default/files/WesternArcticCaribouHerdRange.zip"/><dcat:mediaType>application/zip</dcat:mediaType><dct:format>zip</dct:format><dcat:byteSize>641969</dcat:byteSize><foaf:page>https://accscatalog.uaa.alaska.edu/dataset/ranges-arctic-alaska-caribou-herds/resource/2f56f07a-e12b-49b4-95a2-ba7937246593</foaf:page></dcat:Distribution><dcat:Distribution rdf:about="https://accscatalog.uaa.alaska.edu/dataset/north-slope-rapid-ecoregional-assessment/resource/4ae9667f-f28e-4ec5-aa16-b6b629f03020"><dct:title>Seasonal Forage Quality for Caribou on the North Slope</dct:title><dct:description><![CDATA[<p>Caribou have adapted a life cycle that favors nutrient and energy conservation in the winter months and rapid growth and energy/nutrient storage in summer months. Preferred forage species are highly dependent on season. Nutrient and digestible energy content in plants is linked to growth stage. Seasonal forage preferences of caribou correlate to the plants species, plant parts, and growth stage that contain the highest available nutrients and energy at the time. Vegetation communities preferred by caribou are thus seasonally dependent.</p>
<p><a href="/sites/default/files/styles/panopoly_image_original/public/Figure_NorthSlopeCaribouForage.jpg"><center><img alt="Calving Forage Quality of North Slope Caribou Herds" title="Calving Forage Quality of North Slope Caribou Herds" height="500" width="647" src="/sites/default/files/styles/panopoly_image_original/public/Figure_NorthSlopeCaribouForage.jpg" /></center></a></p>
]]></dct:description><dct:issued>2018-02-20T09:37:49-09:00</dct:issued><dct:modified>2019-02-01T12:12:05-09:00</dct:modified><dcat:accessURL rdf:resource=""/><dcat:downloadURL rdf:resource="https://accscatalog.uaa.alaska.edu/sites/default/files/REA_NorthSlope_CaribouForageQuality.zip"/><dcat:mediaType>application/zip</dcat:mediaType><dct:format>zip</dct:format><dcat:byteSize>191366911</dcat:byteSize><foaf:page>https://accscatalog.uaa.alaska.edu/dataset/north-slope-rapid-ecoregional-assessment/resource/4ae9667f-f28e-4ec5-aa16-b6b629f03020</foaf:page></dcat:Distribution><foaf:Agent rdf:about="https://accscatalog.uaa.alaska.edu/publisher/n0"><foaf:name>DKAN</foaf:name><foaf:homepage>https://accscatalog.uaa.alaska.edu</foaf:homepage><dct:type rdf:resource="http://purl.org/adms/publishertype/NonProfitOrganisation"/></foaf:Agent></rdf:RDF>