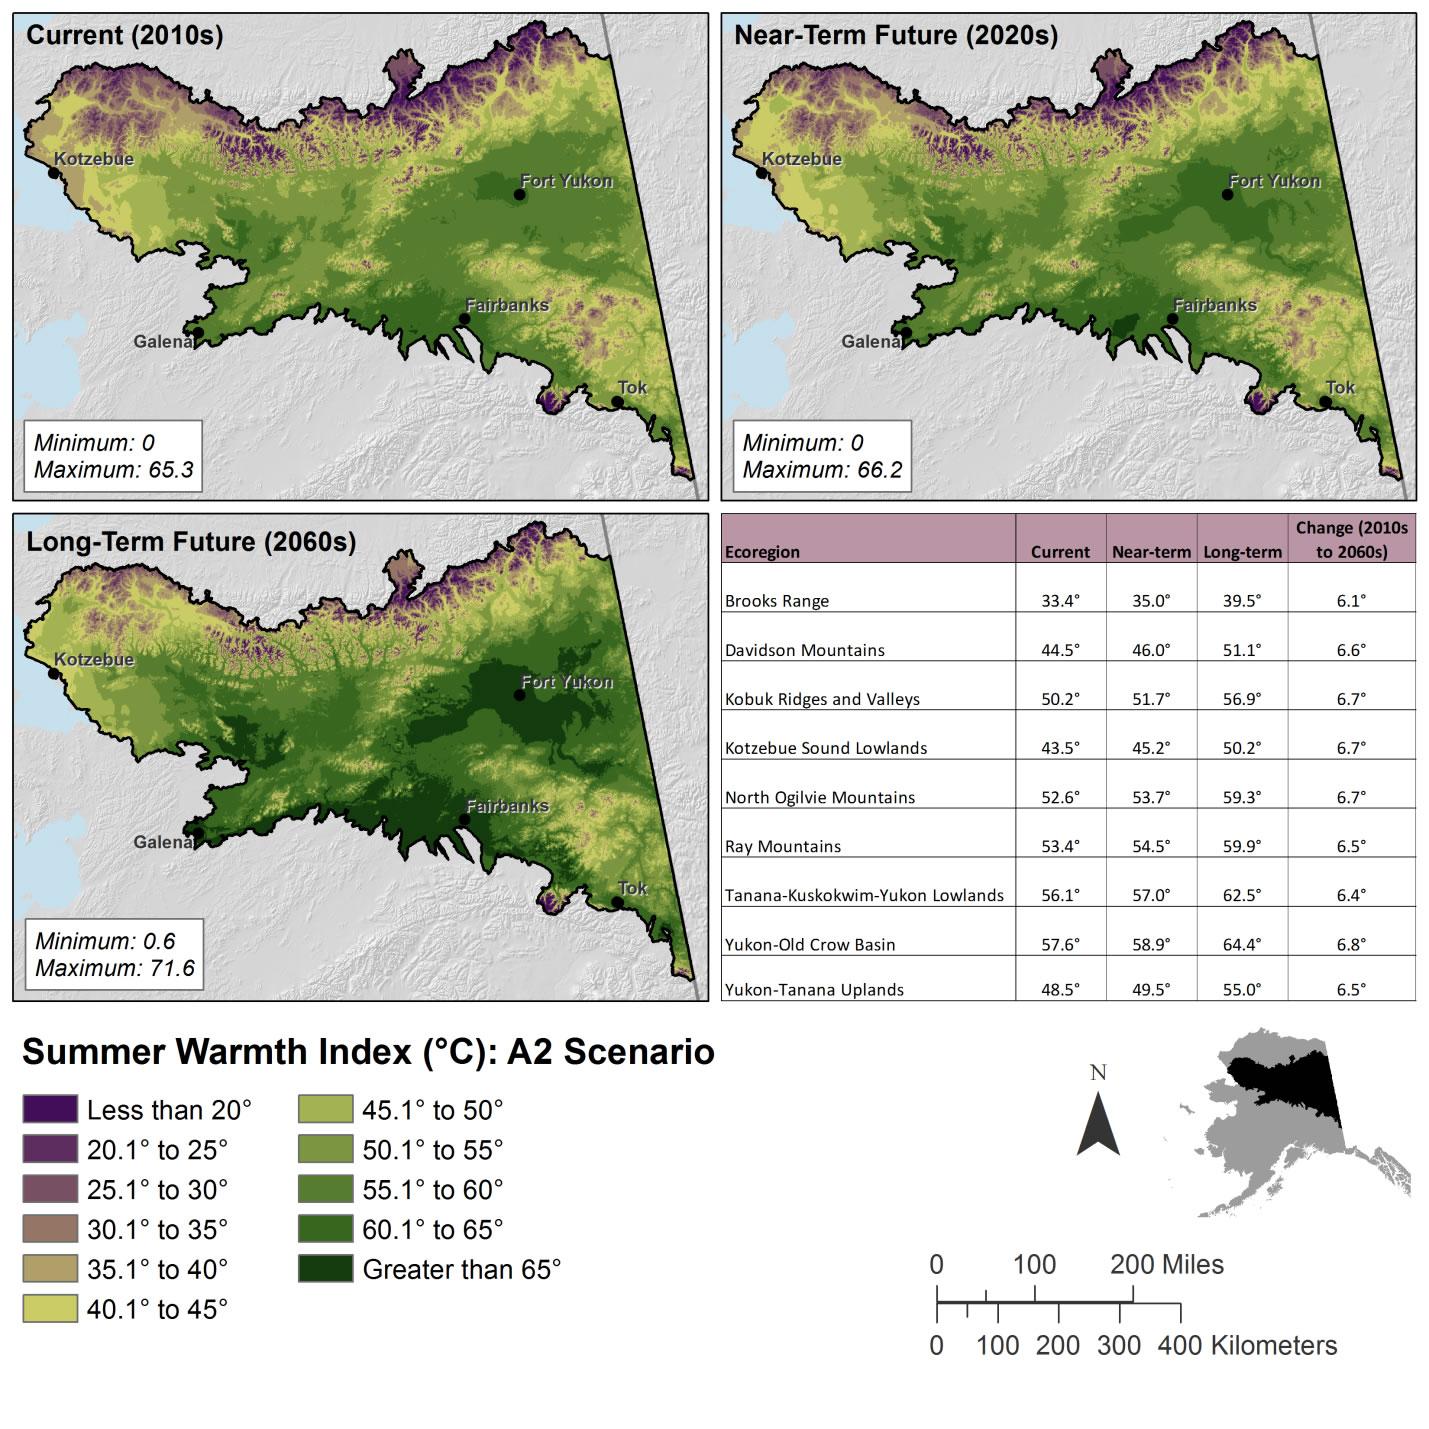
Summer warmth index (SWI) is calculated as the sum of mean monthly temperatures > 0 °C. SWI is an index that has been used to measure linkages between climate change and changes in vegetation. SWI can be used instead of date of thaw (DOT), date of freeze (DOF), length of growing season (LOGS), and July temperature data or in conjunctions with these metrics to determine potential impacts, depending on whether a species or assemblage is more dependent on the duration, extremes, timing, or overall warmth of the summer season. While LOGS is measured in units of time, SWI is measured in units of degrees Celsius. This dataset includes a downscaled projection of Summer Warmth Index (cumulative mean June, July, and August temperatures above 0°C), in degrees Celsius, for the decades 2010-2019, 2020-2029, and 2060-2069 at 771x771 meter spatial resolution. The file represents a sum of decadal monthly mean temperatures, using the A2 emissions scenario.
12 files in this archive
- CYR_CL_C_SummerWarmthIndex_A2.img
- CYR_CL_C_SummerWarmthIndex_A2.img.aux.xml
- CYR_CL_C_SummerWarmthIndex_A2.lyr
- CYR_CL_C_SummerWarmthIndex_A2.xml
- CYR_CL_L_SummerWarmthIndex_A2.img
- CYR_CL_L_SummerWarmthIndex_A2.img.aux.xml
- CYR_CL_L_SummerWarmthIndex_A2.lyr
- CYR_CL_L_SummerWarmthIndex_A2.xml
- CYR_CL_N_SummerWarmthIndex_A2.img
- CYR_CL_N_SummerWarmthIndex_A2.img.aux.xml
- CYR_CL_N_SummerWarmthIndex_A2.lyr
- CYR_CL_N_SummerWarmthIndex_A2.xml

